| Charting | Barcodes | Store | Support | Contact Us |
|
|
|
Chartbot™
Data Charting |
 |
|||||||||||||||||||||||||||||||||||||
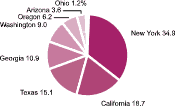
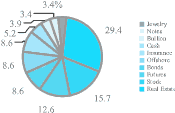
| It's easy to create a few charts, but mass-producing them slows down any professional publishing workflow. You could use an assembly line to reduce turnaround and cost—or an industrial robot. | ||||||||||||||||||||||||||||||||||||||
|
Meet Chartbot. He'll quickly turn out mass quantities of publication-quality charts right from Adobe InDesign™. The results are slick, print very fast, and don't need checking or reworking. And Chartbot never makes messy mistakes like overlapping on-chart text. Excel's brains, Illustrator's looks. Most organizations choose between MS Excel™ and Adobe Illustrator™ to produce charts for InDesign. Simplicity vs. designer looks. Chartbot has both, including automatic on-chart data legends and values. 1-Step workflow.
No reworking, no checking. Chartbot eliminates the costly proofing and reworking cycle for charts: it is designed for truly unattended operation. You can set options to automatically "do the right thing" over wide ranges of data, quantities of data, or missing data. Once set up, a Chartbot chart in effect needs no checking over multiple data revisions or versions. Print
speed all its own. Chartbot's charts usually
print at or near your printer's full rated speed, so even
production printers usually
don't slow down for charts. |
|
|||||||||||||||||||||||||||||||||||||
Copyright © 2012 - 2022 Soft Horizons All trademarks are property of respective owners. Privacy Policy


